
Rolling back into the house about two weeks ago I was greeted by the sweet, dulcet tones of gulls flying overhead. A few days later, I noted that the opening waters of Westchester Lagoon had invited a returning swan to rest while heading north. While in Kotzebue last week I overheard conversations by both locals and U.S. National Park staff about when geese would arrive in the rapidly thawing north. Clearly, the spring migration is “on”. It won’t be long now before songbirds begin their early morning serenades which mark true spring weather and the advent of the “green” season.
While the spring migration is always welcome, there’s another migration that is on my mind: the migration of Alaskans out-of-the-state. In the last two weeks three close associates told me that they have plans to leave the state. All are long-time or natural-born Alaskans. All have advanced degrees or extensive technical educations. All have at least a decade left in the work life and all are civically active. In short, these people are the proverbial “best and brightest.” The states they’re moving to will be richer for their presence and we will be collectively poorer.
I wrote about Alaska’s long-term population trends last September (perhaps I’m on the birds’ migration cycle when it comes to writing about population) and I don’t want to rehash the article. In summary, we’re amid our longest and deepest period of net outmigration; each year since 2012-2013 more people left Alaska than have moved to Alaska. We only have migration data through 2016-2017, but I have not doubt that the outmigration trend continued through 2018 and will very likely continue through 2019. What I didn’t discuss in September was the Who of net migration. Who is leaving Alaska and what does the loss of their contribution mean for the State? It’s a question that was asked of me recently and I realize that I don’t have the answer. We’ve always been a high migration state with the equivalent of more than 10 percent of our population turning over in any given year, but what do current trends mean for us?
The best data for tracking moves is income tax data from the U.S. Internal Revenue Service (IRS) and State of Alaska Permanent Fund Divided (PFD) data. I’ll start with the IRS data. When we file our taxes, we provide our addresses and social security numbers for taxpayers and dependents. Income tax filings and tax payments could provide near real time tracking of moves. However, while the data that’s available from the IRS is relatively up-to-date (2016 data now available) it focuses on “where” and not “who”. The IRS data for 2015-2016 tell us that volume of moves to/from Alaska is from the largest states and those closest to us: Washington, California, Texas, Oregon, and Florida. There’s no great surprise there. If we look at the other 49 states, just 15 sent us more tax filers than we sent them, and the net margins were pretty thin. California, Kansas, Illinois, Georgia, and Pennsylvania were the top donors, and none had a net margin greater than 60 tax filers. On the flip side, 33 states received more Alaskans than sent us new tax filers. Hundreds more Alaskan U.S. income tax filers moved to WA, OR, AZ, ID, and TX than moved to Alaska.
- Table 1. Top States for Migration to/from Alaska
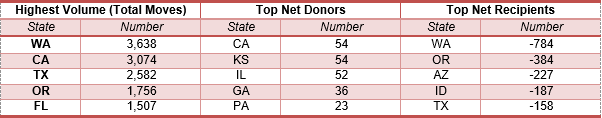
Source: https://www.irs.gov/statistics/soi-tax-stats-migration-data
The best source of available “Who” data is our own PFD data. The challenge with PFD data is that while the state does an excellent job of updating in-state migration data between boroughs and census areas, there are (understandably) less resources devoted to understanding interstate migrations. While the intrastate data is available through 2018 on annual level, interstate data is only available in 5-year snap shots with 2010-2015 data as the available snapshot. Alaska’s current recession started in 2015 so the last snapshot doesn’t capture the last four years of negative net migration, but it does capture the beginning of the outmigration which started in 2012/2013. Some of that outmigration was “pent up demand” as people stayed in Alaska while waiting for the Lower 48 economy to improve. Let’s look at how migration has changed from 2000-2005 to 2005-2010 to 2010-2015. The data show us that:
- For the 0-14 age group, Alaska was attractive families with young children for both the 2000-2005 and 2005-2010 periods. In that decade we averaged more than 800 net migrants a year. However, between 2010 and 2015 we lost school age children. We know that many school districts in the state are shrinking, so I expect the 2015-2020 data will show that this trend continues today.
- The 15-19 and 20-24 age groups are linked. We traditionally lose part of the first group as students head to college and we gain some of them back as they return home from college (or decide college outside isn’t for them). We see from the data that the 2005-2010 period was better than either the 2000-2005 or the 2010-2015 period. The smaller losses (15-19) and larger gains (20-24) in this period likely reflects the relative strength of the Alaska economy during this period.
- From 2010-2015 we gained an average of 880 residents a year for the 25-34 group. So, we were still an attractive option for young adults during that period. However, our annual gain for that period was 40 percent lower than it was from 2000-2010 when we were gaining 1,500 residents a year from this group. Not to offend to any other age group mentioned here but attracting new residents in this group is key. This group has the freshest skill set, it forms the basis of future homebuyers, and it’s the group that’s going to add children to the school system. Becoming less attractive to this group can bode poorly for future growth.
- The 35-54 group is the prime working age population. This group left from 2000-2005 (-290/yr), they came from 2005-2010 (+393/yr), and they started moving again in 2010-2015 (-641/yr). In some ways this group should be the least likely of the adults to move. They’re deep into careers, very likely to own homes, and are most likely to have children in the school system. The net swing for this group from 2005-2010 to 2010-2015 is nearly 1,000 individuals a year. It’s tough to lose these prime producers from the economy.
- The 55-69 and 70+ age groups are groups that have historically left Alaska. Total net migration numbers increased 80% for the 55-69 group and increased nearly 200% for the 70+ group between 2005-2010 and 2010-2015. There’s a complicated story going on here. Many older residents delayed their outmigration in the 2005-2010 period because the Lower 48 economy was in recession between 2008 and 2010. Outmigration for Alaska picked up after 2010. In addition, there are more of these citizens in the population pool than ever before with the baby boomers hitting/approaching retirement age. Research by ISER, amongst others shows, we’re keeping more of these citizens than ever before, but we’re likely losing more than ever before too. The fixed income of these citizens provides a stabilizing influence on the economy and we want to keep these folks around.
Table 2. Annual Average Net Migration based on PFD Data
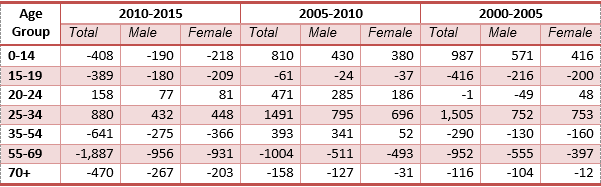
Source: http://live.laborstats.alaska.gov/pop/migration.cfm
Unfortunately, I’m not able to answer the “who” question to my satisfaction. The “who” matters because “brain drain” is a real thing. When your young leave you lose your future workforce. When your middle-groups leave, you lose your current work force and your most up-to-date skills. When our elders leave we lose their institutional knowledge, their dedication to a place they’ve lived a long-time, and the stabilizing effects of their fixed incomes.
If you’re interested in reading more about internal and external migration I highly recommend the Alaska Department of Labor’s March 2018 Alaska Economic Trends article on this topic.
Jonathan’s Takeaway: Alaska exhibits worrying trends across the board particularly, in my opinion, when it comes to our younger residents. Our vibrancy will depend on us being an attractive place to settle and raise a family. Families beget economic growth and in the long-run economic stability as grandparents choose to stay near their grandchildren. What are we doing to make ourselves attractive to these individual economic engines?
Jonathan King is a consulting economist and Certified Professional Coach. His firm, Halcyon Consulting, is dedicated to helping clients reach their goals through accountability, integrity, and personal growth. Jonathan has 22 years of social science consulting experience including 16 years in Alaska. The comments in this blog do not necessarily represent the view of employers and clients past or present and are Jonathan’s alone. Suggested blog topics, constructive feedback, and comments are desired at askjonathan@apcm.net.
4/17/19