![]() What a month October was. Markets went in a direction that made investors pause, and volatility (often considered the market term for “risk”) dominated the headlines. At APCM, investment team members spent our time digesting economic and financial market data to look beneath the headlines and determine if these movements materially impacted our current outlook and positioning. After confirming our mid-year outlook, we had a robust discussion on risk and what it means for our portfolios, so I’d like to share the highlights with you.
What a month October was. Markets went in a direction that made investors pause, and volatility (often considered the market term for “risk”) dominated the headlines. At APCM, investment team members spent our time digesting economic and financial market data to look beneath the headlines and determine if these movements materially impacted our current outlook and positioning. After confirming our mid-year outlook, we had a robust discussion on risk and what it means for our portfolios, so I’d like to share the highlights with you.
What is risk?
According to the Oxford English Dictionary, risk can be defined in two ways:
Definition 1: the chance or hazard of commercial loss…
Definition 2: …the chance that is accepted in economic enterprise and considered the source of profit
For investors, the second definition is just as important as the first. If you could meet your financial goals by investing in a risk free option (e.g. cash in your bank account or U.S. Treasury securities) then by all means we would recommend that. However, the majority of investors must accept some level of risk in order to meet their financial objectives. So what does this mean for you? Not all risk is bad and it’s actually the source of the return that you need to earn to meet your goals. Our job as your financial advisor is to make sure that you’re appropriately compensated for the amount of risk that you take.
How is risk measured?
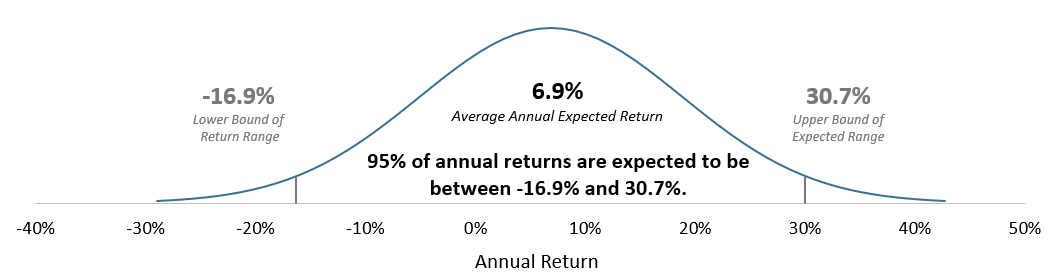
One of the ways that we can quantify risk is by looking at the range of outcomes around our expected return, or the standard deviation for all of my fellow statistics peeps. The chart below depicts this range of expected outcomes for our 70% equity model portfolio. We expect a long term average annual return of 6.9%. Within this long time period, we expect 95% of actual returns to be between -16.9% and 30.7%.
What about downside risk?
I’m going to geek out for a bit, but if you hang with me I promise it will be worth it. Since we know that risk is both upside potential and downside potential, is it possible to quantify the amount of upside and downside? Why, that’s a great question! There’s actually a statistical term called semi-variance that allows us to isolate the ups from the downs. When we look at the semi-variance for U.S. Large cap stocks over a 10 year and a 15 year period, we notice that risk is evenly distributed between the upside and the downside. So when headlines say that volatility is picking up, half of the time this is actually a good thing for your portfolio!
Dealing with Risk
What investors have experienced in the last month is uncomfortable. It’s not pleasant to check your account and see that you’ve lost money, and I can’t promise that markets won’t end the year even lower. But what I can say with confidence (95% confidence to be exact) is that this is anticipated and it’s accounted for in your long term planning projections. APCM utilizes realistic return and risk assumptions when developing your portfolio return, so this is all baked into your financial plan. In fact, reducing “risk” during a negative period will often mean that an investor will not participate in the positive returns of a recovery. As we know that it’s very difficult to time the markets, reducing risk at the wrong time can actually lead to worse outcomes than staying invested at the appropriate risk level.
Kirsten Halpin, CAIA, FRM®
Senior Investment Analyst
11/7/18