In a normal environment, financial markets generally operate in an efficient manner where market participants are able to execute trades quickly and at reasonable prices. The past three months have been anything but normal and there have been several market dislocations in disparate areas. A “market dislocation’ is a circumstance where financial markets, operating under stressful conditions, cease to price assets correctly either on an absolute, relative or intrinsic basis. These dislocations can dramatically increase the challenge of how to invest because the when, where and how much of each event is nearly impossible to predict. And yet, they are part of the world in which we live. As much as possible, investors need to have a plan for how to deal with them.
As an example, many Alaskans may have experienced angst on April 20th as oil prices turned slightly negative in the morning and then quickly dropped to what were previously unfathomable lows. A late-day screenshot of Spot Oil prices on Bloomberg showed Alaska North Slope Crude trading at negative $49.63/barrel.
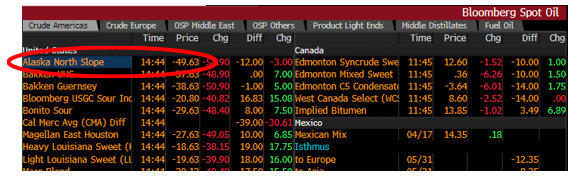
Figure 1 Source: Bloomberg, April 20, 2020
Where had all the buyers gone? What could possibly cause owners of Alaska oil to want to pay to get rid of it? Recall that oil markets had been roiled by the Saudi Arabia’s decision to dramatically increase their production at the same time the world was shutting down due to Covid-19 and the need to turn oil into gasoline or jet fuel was plummeting. Even though Saudi later decided to cut their output by almost 10 million barrels/day, supply continued to outpace demand by 20-30 million barrels/day according to some estimates. By late April, the available space to store additional oil was nearing zero. The oil price quoted in Figure 1 was a commodity contract with a delivery date in May and with storage tanks full, traders in April did not want to risk being forced to accept physical delivery. As a result, for two days only, they were willing to pay somebody else to take the problem of physical delivery off their hands. Once that issue was resolved, (as May delivery moved into June) market pricing efficiency was able to return. Oil prices moved back above zero and have remained there.
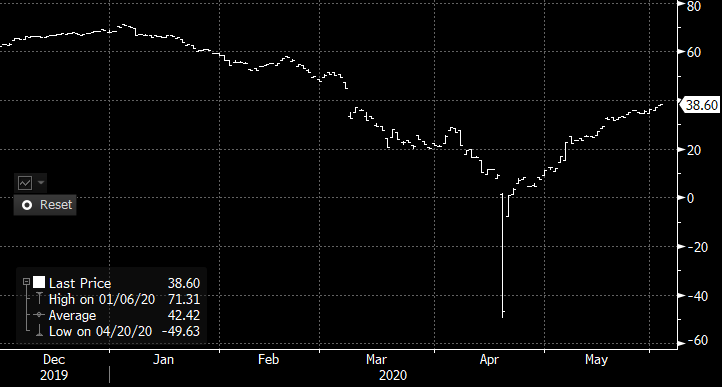
Figure 2: Alaska North Slope Crude – West Coast Spot Price Index, source: Bloomberg
As another example, the Exchange Traded Fund (ETF) market for Municipal traded bonds recently experienced a dislocation between the ETF traded price and the underlying Net Asset Value of the Munis owned by the ETF. Under normal circumstances (when markets are trading efficiently), an ETF will trade at a price which is very close to the value of the securities that it owns. Theoretically, if an ETF is trading at a different price than its underlying securities, investors could execute arbitrage trades which would force the prices back towards parity. In the last half of March, that didn’t happen.
The largest Muni ETF tracked by Bloomberg is the iShares National Muni Bond ETF (ticker: MUB) which has about $16.6 billion in assets and is highly liquid. Figure 3 shows that in the normal market environment before mid-March, the price of the ETF traded at almost exactly the Net Asset Value of the underlying municipal securities the fund held. Starting on March 12, the price of the ETF fell both farther and faster than the value of the underlying municipal securities that it owned. On March 18th, that difference was over 5%.
In mid-March the market experienced a flight-to-quality event as the country started to get shut down and many people went into self-quarantine. So, many ETF shareholders took advantage of the ‘push-a-single-button’ ease with which they could liquidate their Muni exposure and unloaded their positions into a market where buyers were suddenly scarce. At the same time, while the underlying Muni valuations did move lower, they did not decline as rapidly as the ETF was sold, resulting in a price dislocation.
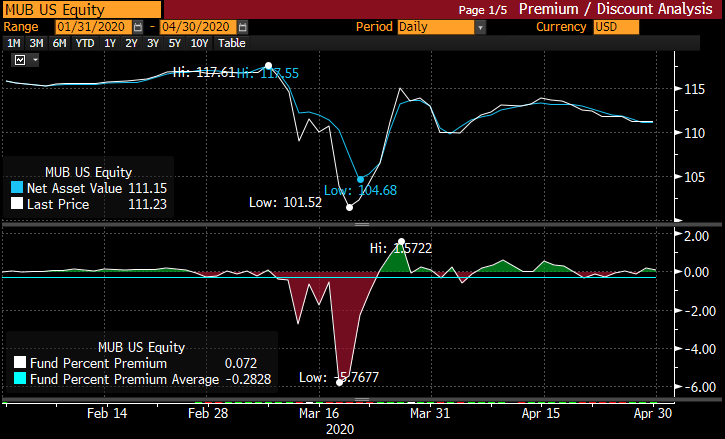
Figure 3 Net Asset Value vs ETF Price for iShares National Muni Bond ETF (ticker: MUB), source: Bloomberg
In an environment where 30 million people are suddenly unemployed it is reasonable to anticipate that there will be other market dislocations. Being able to view these events in their proper historical context can help investors avoid reacting inappropriately, and looking back over the course of investment history, the list of market dislocations is lengthy. Some of the more notable include:
- “Black Monday” – October 1987 market rout
- Currency crisis of 1997-1998
- 1998 failure of Long Term Capital Management
- 2001 bursting of the Technology bubble
- 2008-2009 Global Financial Crisis
- 2010 Flash Crash (driven by Algorithms and High Frequency Traders)
- 2015 Flash Crash (driven by the Chinese Shanghai Composite being down -8.5%)
While all of these events were significant at the time, every single one of them was eventually resolved and market efficiency returned. Strategies for dealing with market dislocations can include a well-diversified portfolio, dollar-cost averaging, and regular and routine rebalancing of risk exposures.
Paul Hanson, CFA®
Portfolio Manager
06/08/2020