The U.S. economy is humming along at a great pace right now. Corporate earnings are up an impressive 24% versus a year earlier, and a larger number of companies are beating earnings estimates than normal (80% of companies that have reported second quarter results beat estimates, the highest reading since FactSet began tracking the measure). For the second quarter, real U.S. GDP grew at an annualized rate of 4.1%. In fact, last year U.S. GDP rose meaningfully above potential (trend) GDP for the first time since before the Global Financial Crisis. But what is potential GDP, how can the U.S. grow above potential, and how long can an economy operate above potential?
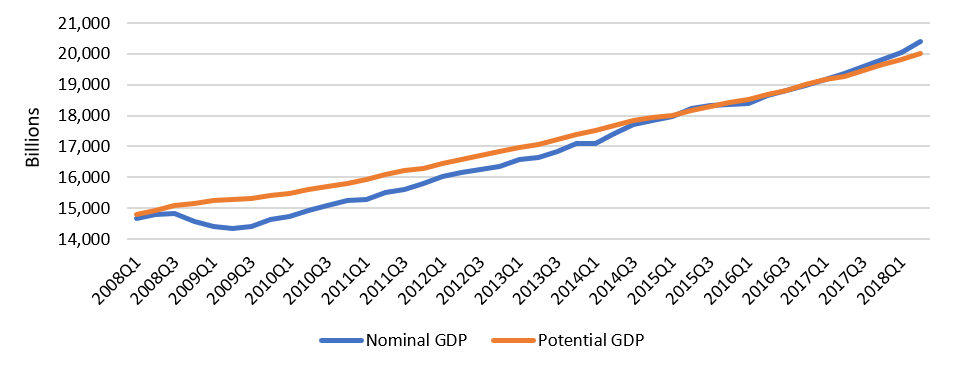
Chart 1: U.S. GDP
What Is Potential GDP?
Potential GDP, also referred to as natural or trend GDP, usually refers to what an economy is expected to produce if it were to grow at the projected long-term growth rate. In other words, if you strip out the effects of the business cycle on GDP, what would GDP be? As depicted in the chart below, actual GDP goes through cycles based on the economic environment, but those cycles occur around the trend growth rate.
Chart 2: Business Cycle
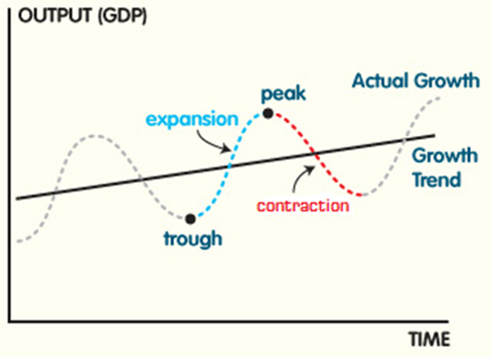
Source: https://courses.lumenlearning.com/wmopen-introbusiness/chapter/economic-stages/
How Can the U.S. Grow Above Potential?
GDP is determined by the number of workers employed, the amount of capital invested (equipment used in production), and how efficient workers are (productivity). So, determining potential GDP is about trying to predict the sustainable levels of those three factors.
Chart 3: What Drives Long-Term Growth?
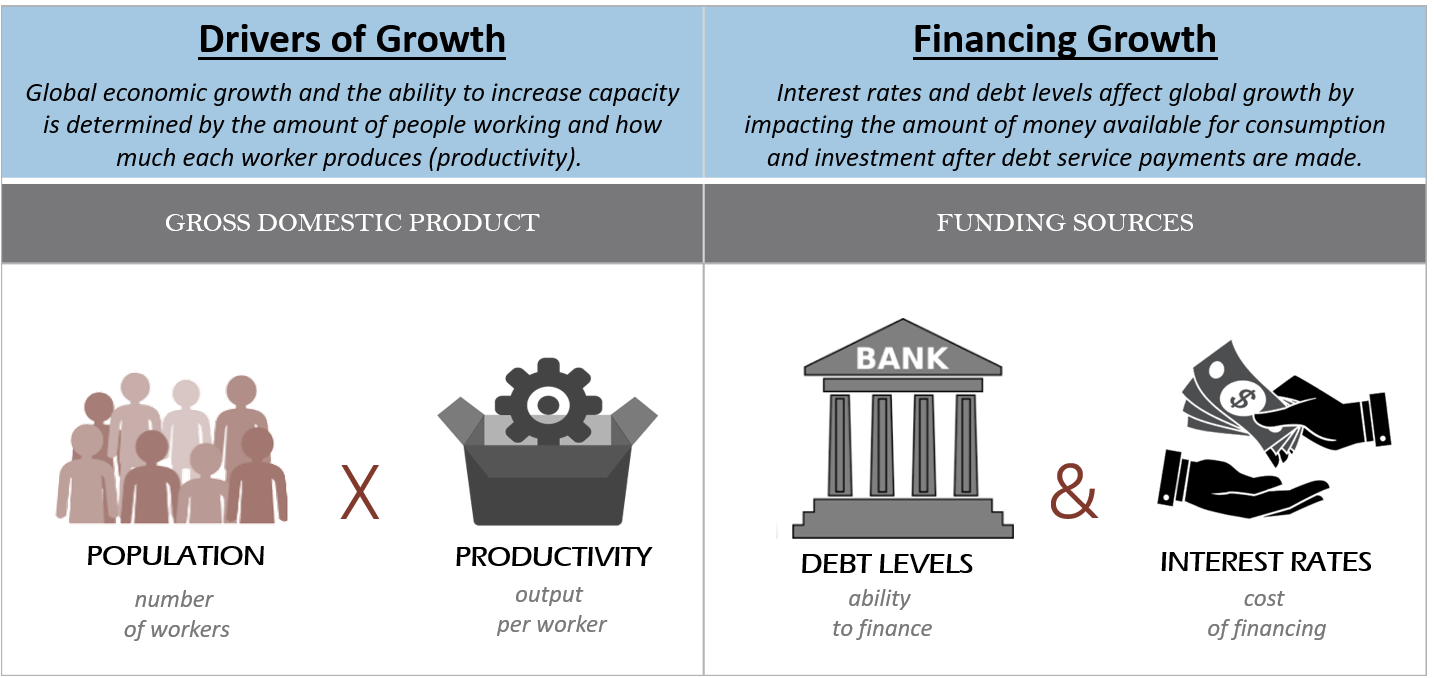
If those three factors determine GDP, then an increase in the number of workers employed or the amount of capital investment above the long-term sustainable rate would temporarily boost GDP above potential GDP (increases in productivity tend to have permanent effects, and so increase potential GDP). For example, if something were to happen that temporarily and artificially boosted consumer or government spending, then demand would increase and companies would have to hire more workers or invest in new production capacity (or both) to meet that increased demand.
Real U.S. GDP grew at an annualized rate of 4.1% last quarter, whereas the real potential GDP growth rate is estimated to be about 1.9% according to the Congressional Budget Office (CBO). The current growth rate is over 2% above potential – it certainly seems like the economy is having a party.
How Did the GDP Party Get Started?
There are several factors that have led to above potential GDP, from low economic volatility to high consumer confidence. However, those factors were in place at this time last year as well, when GDP growth was 3%. That was good growth as well, and above the potential GDP growth rate, but a full percentage point below the most recent reading. What has changed since the end of last year is the application of fiscal stimulus.
- At the end of last year, the U.S. government passed a tax reform bill that reduced corporate and personal income taxes. In the short-term, this was expected to increase personal spending, which we have seen the first signs of in the most recent GDP numbers as personal consumption (which accounts for approximately 70% of U.S. GDP) increased at a 4% pace (the highest since 2015). This boost is expected to fade soon as consumers adjust the spending to their new after-tax income levels.
- On top of the tax cut, the government also passed a spending bill in March that saw an $80 billion increase in defense spending and a $63 billion increase in spending on domestic programs. We begin to see these measures have an effect on GDP growth as national defense increased at a 5.5% year-over-year rate vs. 3% for the previous quarter, and government gross investment increased at a 3.3% rate vs. 1.4% for the previous quarter.
This fiscal stimulus is expected to add 1.5% to real GDP by 2020 and the increased demand will lead to lower unemployment, below 3.5%, both according to the International Monetary Fund (IMF).
How Long Can an Economy Operate Above Potential?
There is no rule that gives us an exact answer to this question, but we do know that at some point growth must slow down. As Chart 2 shows, there will be a peak, and a contraction that follows. There are a few reasons this occurs.
- First, the fiscal stimulus noted above is fueled by debt – the lower taxes and higher spending has to be paid for somehow. The IMF projects that the fiscal stimulus will cause a single year’s spending to increase the deficit by more than 4.5% of GDP by 2019 (nearly double that of 2015). At some point the federal government will need to reduce spending and/or increase taxes to deal with the higher deficit spending.
- Second, real GDP growth above potential puts upward pressure on inflation through labor shortages and higher demand for goods. This prompts the Federal Reserve to raise interest rates to avoid runaway inflation. The higher interest rates make businesses require higher returns on investment than before and reduce the return companies get for each additional worker (reducing demand for labor to a more sustainable level) – so, the economy begins to slow.
- Third, a worst-case scenario would be that the strong economic environment and fiscal stimulus will cause an asset bubble to form. So much easy money needs a place to go and people will start to take greater and greater risks for higher returns. Since bubbles, by definition, are unsustainable, the bubble would eventually pop. Such violent economic shocks are usually followed by more severe downturns than other causes for economic slowdowns.
Conclusion
Despite the doom and gloom to finish, the U.S. economy is strong at the moment – the party is in full swing. The Federal Reserve, in order to keep economic volatility low while still preserving its inflation target, has indicated that it would tolerate higher inflation for a short time to avoid shocks to financial markets. Economic data continues to come out strong in the U.S. with high earnings, low unemployment, and muted inflation. APCM watches that data closely for signs that the cyclical outlook is changing and how portfolios may be affected.
Vinay Sharma, CFA®, CIPM®
Senior Investment Analyst
8/8/18